

In 2015, I was running my first startup. It was a laundry services business. We were the new age Dhobis – as my parents would call it – where customers could book the service on an app, choose their preferred pickup & delivery time-slots, and pay online. Our executives would pick up and deliver the clothes – wrapped in a premium packaging as good as new – right at their doorstep. Customers would usually place an order a few times a month. It was a convenient wash + iron service with a premium experience.
During one of our early investor conversations, we were asked: “How do your cohorts look like?”. It was a good question, the only problem was – we had never heard of cohorts until that point. Since we were already tracking a lot of important metrics, we reluctantly started tracking cohorts. After all, we thought, how important could it be for running the business? As it turned out, we were horribly wrong.
Cohorts can tell hidden truths about consistency and discipline of your business which can easily get lost while tracking only the surface metrics. Most companies track user cohorts – commonly accepted criteria for measuring retention. But, when it comes to high-frequency consumer businesses, there are a variety of cohorts that one can track to get deeper consumer insights.
Below are some cohorts that we used to track to get a better understanding of our users and also to test the effectiveness of our business initiatives.
1. Retention cohorts
“If you are in a consumer business and not measuring your retention, you are dead”
The two most important retention cohorts to measure are user retention and revenue retention.
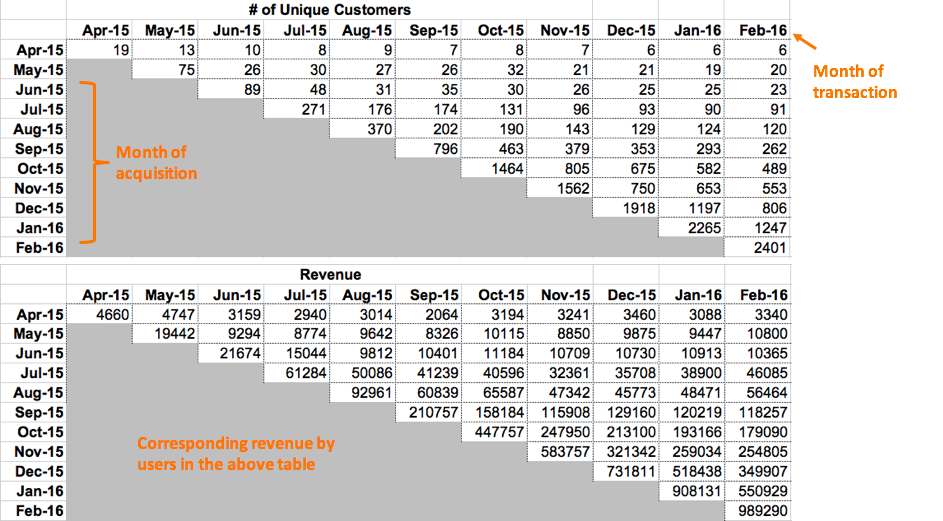
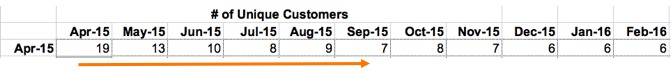
One should read the chart from left to right. The vertical axis (on the left) is the month in which a particular customer was acquired, and the horizontal axis (on the top) is the month in which the users transacted.
For instance, out of 19 transacting users acquired in Apr-15, 13 users transacted in May-15, and then 10 transacted in Jun-15 and so on.
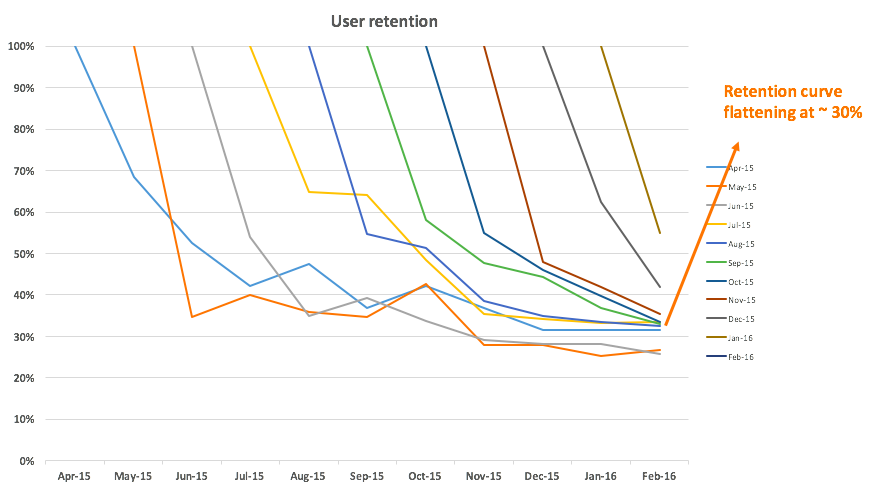
Ideally, you should measure them in %age terms to get a better view.
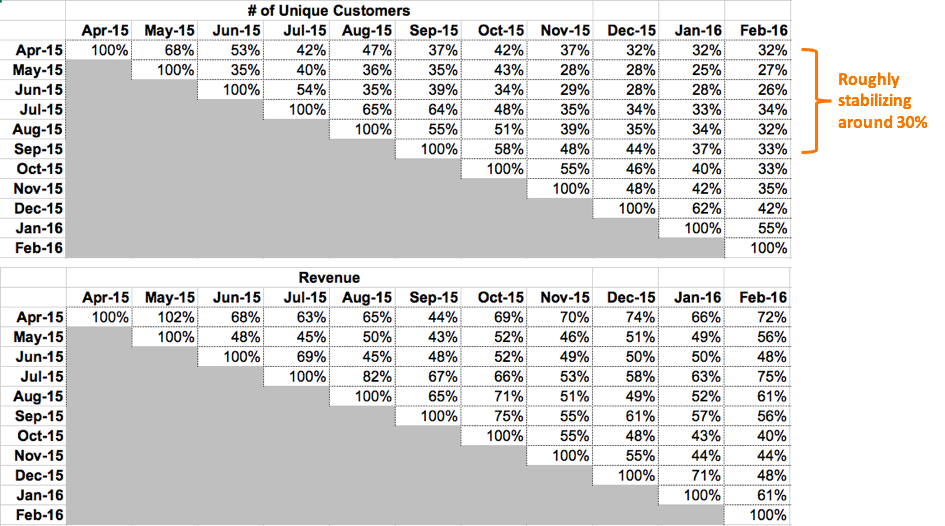
You’ll notice that our retention curve is flattening at ~30% from the 7th month onwards. These were our power users. But, was it a good retention? Typically you should try to recover the entire cohort’s CAC from that cohort’s power users within 6 months targeting an ideal LTV/CAC of 3:1. This results in a retention of ~30%.
We also used to track order cohorts. Although that was not of much significance alone, it was useful in determining behavioral cohorts.
2. Behavioral cohorts
“Knowing who your customer is great, but knowing how they behave is even better”
Two cohorts we used to track that gave us good insights about user behavior were: number of orders/user and revenue/user
Orders/user: For us, this was a measure of stickiness, and like any other business, we would want our customers to get addicted to us. For us, avg order/user increased from ~ 1.2 in initial months to ~2 in Jan/Feb.
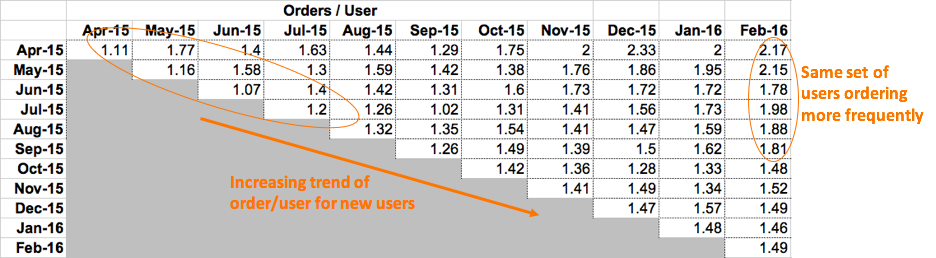
Another interesting trend was that even the frequency of orders for newly acquired users was increasing every month (the diagonal line). This demonstrated increasing brand awareness and trust among the new customers.
Revenue/user: This was a measure of value for us. More the users were willing to spend on our service every passing month, the more they value our service.
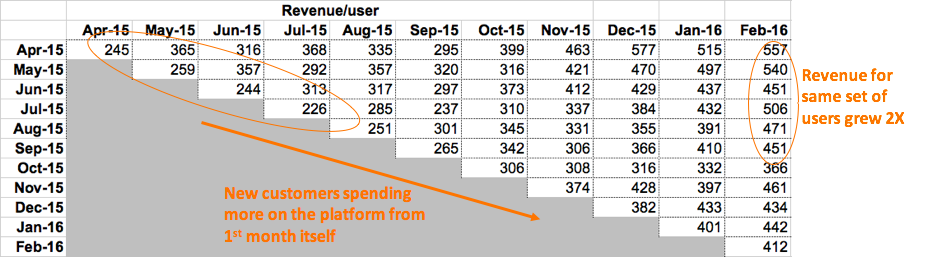
Once again, the two trends to watch are the increasing revenue/user/month of old as well as new users. Customers were spending almost 1.5x-2x the amount after month 6 than they used to spend in their earlier months.
You can also track revenue/order cohort. Although it is just a derivative of the above 2 cohorts, sometimes it is easier to derive insights from it directly.
3. Hypothesis cohorts
“One finds the truth by making a hypothesis and comparing observations with the hypothesis”
We used cohorts to measure the effectiveness of our major initiatives on pricing, discounting and new product lines. It helped us in validating/rejecting our hypothesis for several initiatives. A few examples are mentioned below:
i) Increased referral and first-time discounts
In July 2015, we raised our first round of institutional funding and started referrals and first-order discounts to fuel growth. Discounting also brings the risk of acquiring freeloaders – people who just use the service for discounts and never transition into loyal customers at regular price points.
Have a look at our retention and revenue/order cohorts:
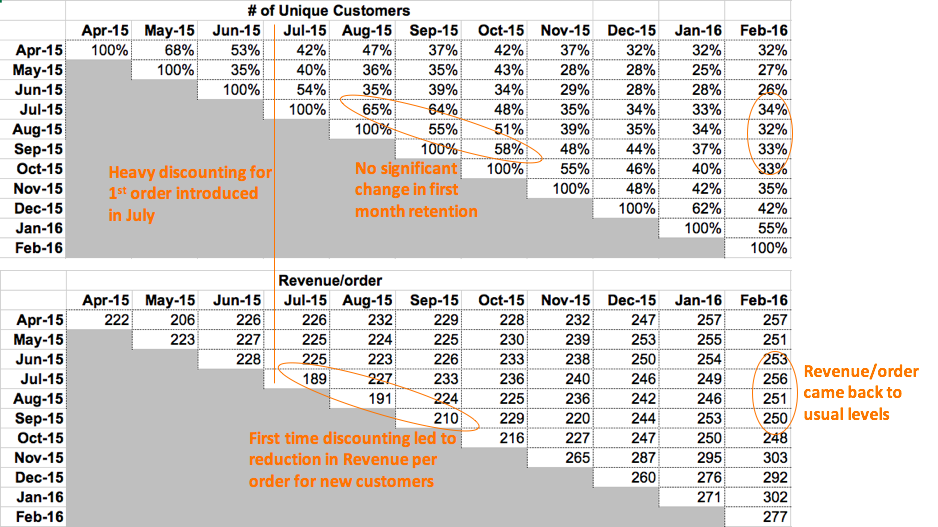
Since it was only a one-time discount, acquiring freeloaders could have resulted in a huge drop in retention in the subsequent month. However, our 2nd month’s retention was broadly the same as it was in any other month.
Also, we could validate in later months that even with similar retention rates, revenue/order for customers acquired in July & Aug was less in the beginning but eventually increased to usual levels.
Conclusion: we were not acquiring freeloaders, and our marketing campaigns were targeting the right TG.
ii) Changed the service from ‘A la carte’ to a ‘packaged’ model
Our average order value (AOV) was too low to earn enough margins. So we started taking initiatives to increase our AOV. One major initiative we took was to shift from pay per cloth model to a fixed-size bag model where customers would be charged per bag, irrespective of the number of clothes they give us. The bag size was carefully chosen to increase the AOV by 15-20%. But we had to be cautious to ensure that customers were not dropping off, so we rolled this model in a phased manner from November 2015 onwards.
Now, check these two cohorts:
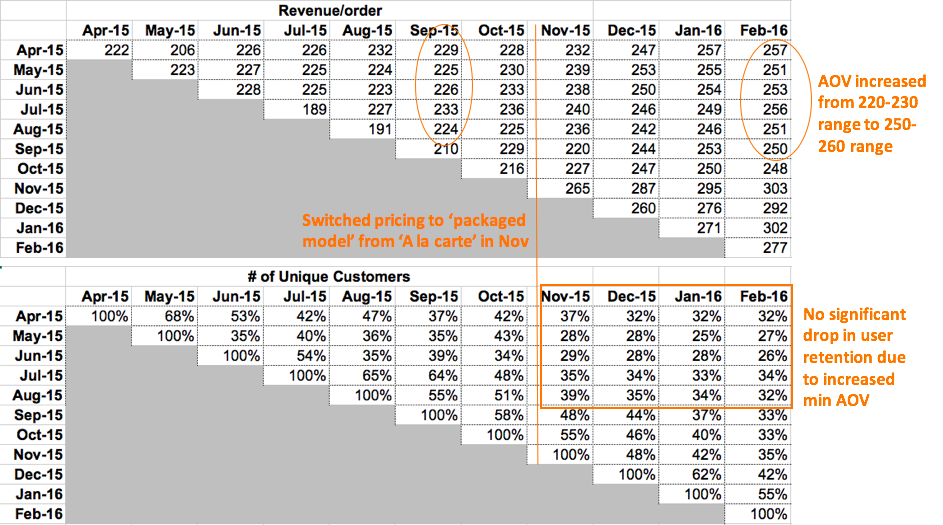
We can see that the AOV gradually increased from 220-230 range to 250-260 range without a significant drop in user retention.
Conclusion: Our customers were willing to give us more clothes in the bag, even if it cost them more, instead of dropping off.
iii) Introduced premium add-ons
In Nov-15, another initiative we took to increase our AOV was introducing two premium add-ons: fragrance & disinfection, each for additional INR 50. Customers could see this as an optional add-on during the checkout process.
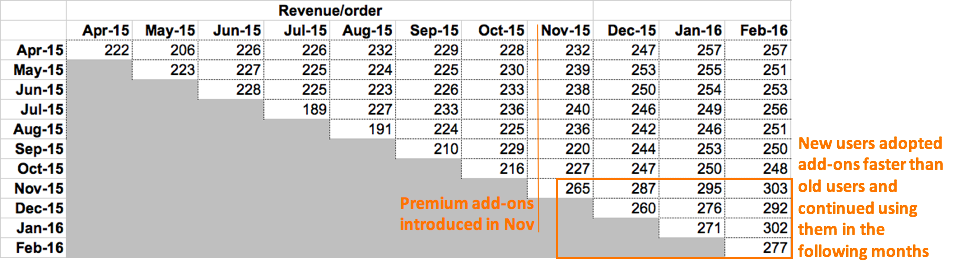
In the above cohort, we could see that from Nov-15 onwards, the AOV is significantly higher for new customers than the customers acquired in the earlier months.
Conclusion: New customers were significantly more willing to try out premium add-ons and continue with it, while the old customers were somewhat reluctant to make any change to their service.
iv) Introduced a new product line – ironing only service
Well, this was a long drawn battle within our teams. The idea was to introduce a new low-priced ironing-only service. It would be easier to acquire customers for this service as they don’t need to change their existing behavior of washing clothes at home. Even though it was a highly loss-making service, our hypothesis was that once people saw the magic of our service, they would upgrade themselves soon to our regular wash + iron service. As some people were not in favor of this, we rolled this out as a pilot project on a small set of customers and started tracking cohorts of ironing-only customers.
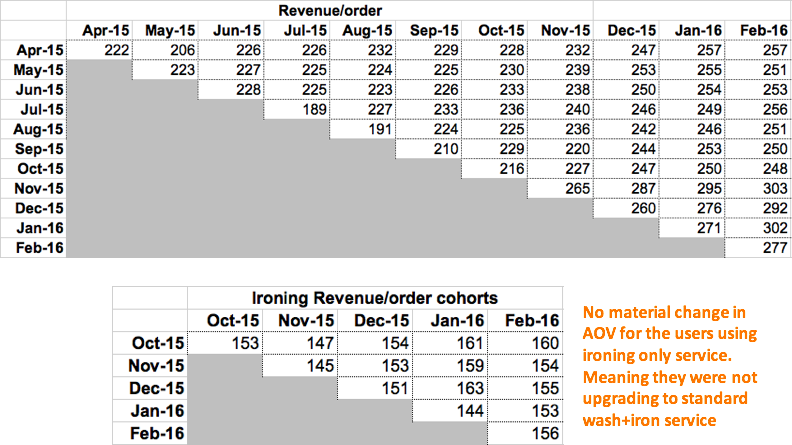
The revenue/order cohort for ironing customers was stable between 150-160 which was the AOV for that service. However, the AOV for regular service in the same months was around 250.
Conclusion: customers acquired for ironing-only service were not upgrading themselves fast enough to be of value to us. We ultimately discontinued the service.
To summarize, cohorts can help identify powerful insights in your business, and help you and your teams make better choices. Also, it’s worth noting that all our hypothesis testing was done using the same set of retention and behavior cohorts. While most of the hypothesis testing can also be done in many different ways, cohorts provide you with a standard way to monitor consumer behavior.
Here is a 5 step process I would recommend to get the best out of your cohort analysis:
1. Identify the right metrics
Any important user action that you capture can be tracked, and not just transactional metrics such as orders and revenue. You should find out what are the important metrics for your business – time spent on the app, the number of sessions, single session time, in-app purchases, NPS, etc. Don’t hesitate to start with more number of metrics and slowly weed out the ones not useful for you.
2. Identify the right frequency
Tracking cohorts at monthly intervals is not necessary. If your users interact with your app/product at a much higher frequency, say almost daily, you are better off tracking weekly cohorts. E.g. gaming, social media, and mobility companies. If users use your service/product once in a few months e.g. a personal care brand, E-commerce, you should track quarterly cohorts.
3. Measure retention cohorts and retention benchmarks
Tracking user retention is a must. You can also measure retention of other important metrics like the number of transactions, revenue etc. Check out when the user retention curve flattens and at what level. Also, figure out your LTV / CAC economics to understand what retention levels would make sense for your business.
4. Measure behavioral cohorts
Tracking cohorts of core actions at a single user level will give insights on user behavior. Core actions correspond to user deriving value from your product or service and/or something that maps closely to your business model. For instance, for a transacting business like ours, core actions are revenue spent per transaction, no. of transactions, monthly revenue etc. While for a gaming business core actions can be in-app purchases, time spent per session etc.
This will often tell you about any change in user habits, increased adoption and the value they prescribe to you in terms of mind share and wallet share. Be patient while tracking this, you’ll not see insights immediately as behavior change usually takes time.
5. Validate assumptions made on user behavior using cohorts
Any new business initiative is usually based on certain user assumptions. One can test the effectiveness of new initiatives and validate the underlying assumptions using the combination of retention and behavioral cohorts.
While most of this hypothesis analysis can be done in several other ways as well, cohort analysis gives you a standard monitoring tool that can track user behavior at a high level.
You can also go into more granularity and track the cohorts of any specific customer segment or geography. This will help you to find out that under what circumstances or for what customer segment the assumptions are valid.
To conclude, there can be many types of cohorts and multiple ways to track them to derive unique insights. I would also love to know what other kick-ass analyses you do with your metrics.
Pro Tip – Try to automate the creation of cohorts at the end of every month on a dashboard. You won’t have to go through the hassle of creating cohorts every month. A one time pain with high ROI.