

As an investor in early stage SaaS companies, I often find founders to be confused on what metrics they should track. Challenge is not a lack of metrics, but too many metrics, with most of them stage irrelevant for the company. For example for a pre-PMF SaaS company, I find engagement metrics to be more important than churn metrics. Simply put, finding something that is working is more important than focusing on what is not. As a company evolves, however, the relevant metrics will change. For example, sales efficiency is a very critical metric as one achieves a certain level of scale. However, focusing on it at the PMF stage is more harmful than good.
There are many articles and sources on the right metrics for SaaS, and the attempt in this blog is not to reinvent metrics. Focus here, instead, is on which metrics to use at what stage of the company, and focus on the few that matter.
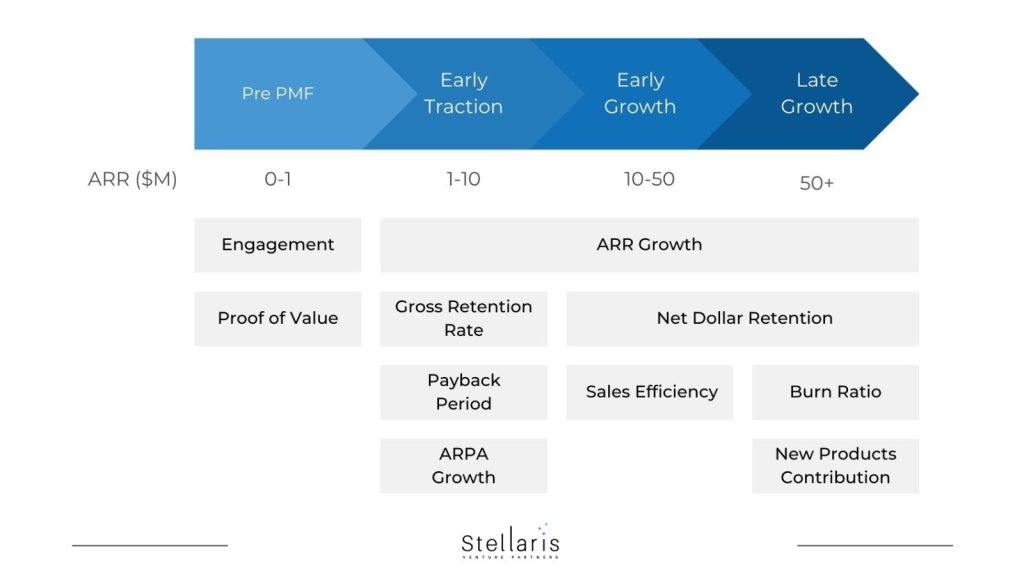
Pre-product market fit (<$1M ARR)
Metrics matter the least at this stage, and overdoing them will not help you build a better company. Only two things matter at this stage:
1. Engagement (Input metric):
This is a measure of who (persona), what (features) and how often (relative to the expectation) users are using your product. For example, for a sales forecasting software that is used by sales ops in a company which has a weekly forecasting process, one would expect at least once a week usage by sales ops and key revenue leaders. On the other hand, for a support chatbot solution, one should look at metrics like percentage of users who used chat as a channel for support instead of phone/ email/ self help. Please note that the actual metric(s) will be different for different products.
At the earliest stage of the business, you are trying to establish whether or not intended users are deriving the value from the product and if you are building the right features. Level of engagement is a very useful proxy. Also note that aggregated metrics across all customers or user types may not be the most useful. At this stage of the business, you are not trying to fix what does not work, but rather figuring out what works. So even if there is a segment of customers or users where there is high engagement, it will help you focus your product towards that segment.
2. Proof of Value (Output metric):
As you generate early users and revenue, engagement alone does not offer product market fit. You need to ascertain the value of your offering through output metrics as well. To continue with our example of sales forecasting, a possible metric is forecasting accuracy, i.e. percentage deviation of actuals and forecast, ideally compared before and after the use of the product.
For some products, it is very easy to attribute the value, and therefore, also identify the metric. For example, one of our portfolio companies Signzy uses AI to automate the process of customer onboarding for financial institutions. What required humans to make judgment on fraud and completeness of documentation can now be done through AI. In this case, total process cycle time (from application to approval), percentage of human override over AI and throughput per backend approval team member are all relevant output metrics.
At the same time, for another company in our portfolio, BuyerAssist, that provides software to help alignment and collaboration within and across the seller and buyer for large B2B deals, the attribution is harder. They measure improvement in conversion rate, increase in deal size and reduction in sales cycle time as proof of value metrics. However, direct attribution is harder. Despite the difficulty of direct attribution, the measurement is critical for you to understand whether or not you are truly delivering the outcomes for your customers.
Early traction ($1M – $10M ARR)
This is the stage of the business where you know you have a product that solves a real customer problem and you are trying to build your distribution engine. Product metrics become less important (with the exception of churn), go to market model metrics become more important.
3. ARR growth:
This is one of the golden metrics of SaaS – how fast you are growing your recurring software revenue. For as long as you exist as a business, this is going to be one of the key metrics. This one needs no explanation. For early stage businesses, 3x growth (i.e. 1M to 3M in 12 months) is par for the course in my opinion. Great businesses have also grown above that. For example, Slintel, a Data as a Service company in our portfolio (now part of 6Sense), grew 5x and 4.5x at this stage in consecutive years. As your ARR grows, the growth will come down. As a thumb rule, after $10M ARR, your growth is still healthy if your growth rate is 82% of your previous year’s growth.1
4. Gross Churn:
I am not a big fan of churn as a key metric in the PMF stage. Most companies I have been part of have had very high churn in the first 2 years. In fact, most of your early customers end up churning. At the PMF stage, you are mostly selling the wrong product to the wrong customer, and therefore, it is not a surprise that they churn.
However, once you are past $1M ARR, you know what you are selling and to whom you are selling. At this stage, churn is a key metric. Since these are early customers, I prefer gross churn, i.e. what percentage of logos stay with you one year after they started with you. It is a very core metric that founders should track. Often people measure NDR (net dollar retention), which is not as useful as many of the ills of your business will get hidden behind the growth of new customers (the denominator effect) and expansion in many of the existing ones (the numerator effect).
If more than 20% of your customers are churning within a year, and the churn is not because of natural attrition e.g. small businesses that themselves die very rapidly, then you have a problem and gross churn is the indicator on your dashboard to identify this problem. In Whatfix, for example, we saw high gross churn at one stage, and as we dug deeper into it, we realized that a lot of purchased software was not getting implemented in time, and therefore value to the customers was not visible. They built a strong professional services team, productized the service offering and also made structural changes to their customer success team to fix the issues.
5. Payback time:
This is a measure of how long it takes for you to recover your customer acquisition cost. It can be calculated by first understanding your customer acquisition cost (CAC), which is the total sales and marketing cost within a period (often a quarter) divided by the number of new customers acquired in the same period. Second, you need to know the ACV (average annual contract value) and the gross margin (revenue minus direct costs which is usually your cloud and customer success costs). Ratio of the two will give you the payback time. For example, if your CAC is $5000, ACV is $10000 and gross margin is 75%, then the ratio is 5000/7500 or 0.66 years or 8 months, i.e. in 8 months you fully recover the cost of acquisition.
I am an ardent fan of this metric and not a closely related metric (CAC/ LTV). In general, at this stage of your business, you do not know what the lifetime value of your customer is, what you know is the cost and the annual contract value. This is the best measure of your unit economics.
Unlike ARR growth, par for the course will be different for different kinds of businesses. For SMB centric businesses with remote sales from India (usually ACVs less than $20K), payback times are often less than one year. For larger enterprise centric businesses, this metric can even be 2-3 years. The reason is that large enterprise sales cycles are very long and the initial land value is typically still small (<$100K), and often not commensurate with CAC. However, such businesses give high expansion revenues. But the longer payback cycles imply a much higher cash burn in early years in these businesses therefore.
6. ARPA or ACV Growth:
Most successful SaaS businesses tend to increase their average contract value (ACV, i.e. first landed contract size) as well as average revenue per account (ARPA) as they grow. You will find continued growth to be very hard with flat ACV and ARPA. Selling more into your existing accounts, moving upstream to larger customers and therefore increasing your landed contract value will ease the pressure on your acquisition funnel and also make your business more sustainable and healthy. While the absolute values are not important, the trajectory is. Whatfix, for example, grew its ACV from $1200 in 2014 to $100K+ in 2022, almost 100x increase in 8 years. For a more detailed explanation on this topic, please refer to earlier blogs – Why Moving Upmarket is important for creating large SaaS companies, and So, how do you move upmarket?
Early Growth Stage ($10M – $50M ARR)
This is the stage of the business where you have the right product as well as the right go-to-market motion, even though the GTM as well as product will continue to evolve. All the metrics from the past are still all relevant, but a few more become important.
7. Net Dollar Retention:
While gross churn matters a lot in the early stages, what begins to matter equally now is how much expansion you are able to do within your existing accounts. The simplest way to measure this is to check how much revenue you were making from all your customers 12 months back (#1), and how much revenue are you making from the same set of customers today (#2). Ratio of #2 to #1 will give you the Net Dollar Retention. This is a metric net of churn.
Good SaaS businesses often have 120% NDR and great SaaS businesses above 140%. However, like with everything else, it depends on the kind of SaaS businesses. For small business centric businesses, 100% NDR may also be very good, and for large enterprise centric businesses, even 120% is not good enough. Signzy in our portfolio, which sells to the largest financial institutions, has had this metric close to 250%.
8. Sales Efficiency:
During the early stage of growth, it is the unit economics of acquiring each customer that matters. However, as your business grows to some scale, you start selling to larger customers and a lot of your revenue begins to come from existing customers, i.e. expansion revenue. Therefore unit economics of new acquisition is not as important as the economics of your overall sales engine. The way to measure this is new ARR added during a quarter divided by the total sales and marketing spend. Notice that the new ARR added is not netted against the churned ARR, as the churned revenue is more driven by customer success and their failure should not be attributed to sales and marketing.
Sales efficiency is higher for SMB centric businesses and lower for larger enterprise centric businesses. For the former, one should expect sales efficiency of more than 1, whereas, even 0.5 is a reasonable outcome for the latter.
One of the puzzling things about building a SaaS business is that this metric is low during PMF (and not even worth measuring), high during early traction, deteriorates during growth stage and becomes more healthy as your growth rates taper and most of your revenue comes from existing customers. So apply judgment of goodness of the absolute measure of this metric, and understand the drivers behind this. Also, do not make knee jerk decisions to improve this metric!
Late Growth Stage: $50M upwards
9. Percentage of new ARR contributed from new products:
As your business grows, you will need more than one engine to carry the load of the train, i.e. your first and your blockbuster product will usually not be sufficient. Most SaaS businesses inevitably end up creating newer SKUs for their sales team to sell. However, new products are always more difficult to sell, and have to usually go through the same cycle of PMF, early traction and then early growth. While the metrics outlined earlier are relevant for the new product lines, at an aggregate level, one should measure the contribution from new products to the new ARR added every quarter. Of course, the metric is ambiguous as new itself is subjective. A good proxy for this is products added within the last 3-5 years. I do not have good benchmarks for it, but below 10% is too little, and above 50% is too much.
10. Burn Ratio:
Outside of ARR growth, this is the other golden metric for me. While ARR growth tells you how fast you are growing, burn ratio tells you at what cost is that growth coming. It is a ratio of net new ARR added within a period or NNARR divided by the net cash burn in the same period. Unlike sales efficiency, this includes R&D and all other corporate costs as well, but is also netted against the cash collected. The numerator is net of churn. Most SaaS businesses are between 0.5 to 1 on this ratio, gradually moving to 1 or better. During the last 2 years, as companies have been flush with cash, this metric has taken a hit, but a healthy SaaS business should be ~1x on burn ratio at around the $50M mark, and approaching a very high number (as the cash burn should be coming close to zero) as they exceed $100M ARR.
As with most things, what I have outlined is a simplified version of the world. Depending on different kinds of businesses e.g. PLG vs SLG, closed source vs open source, the metrics you track will be different. So please apply a healthy judgment as you use these metrics to ascertain applicability to your business.
1Source: Persistence and predictability of SaaS growth, by Christoph Janz